About the KPI paradox
What is the KPI paradox?
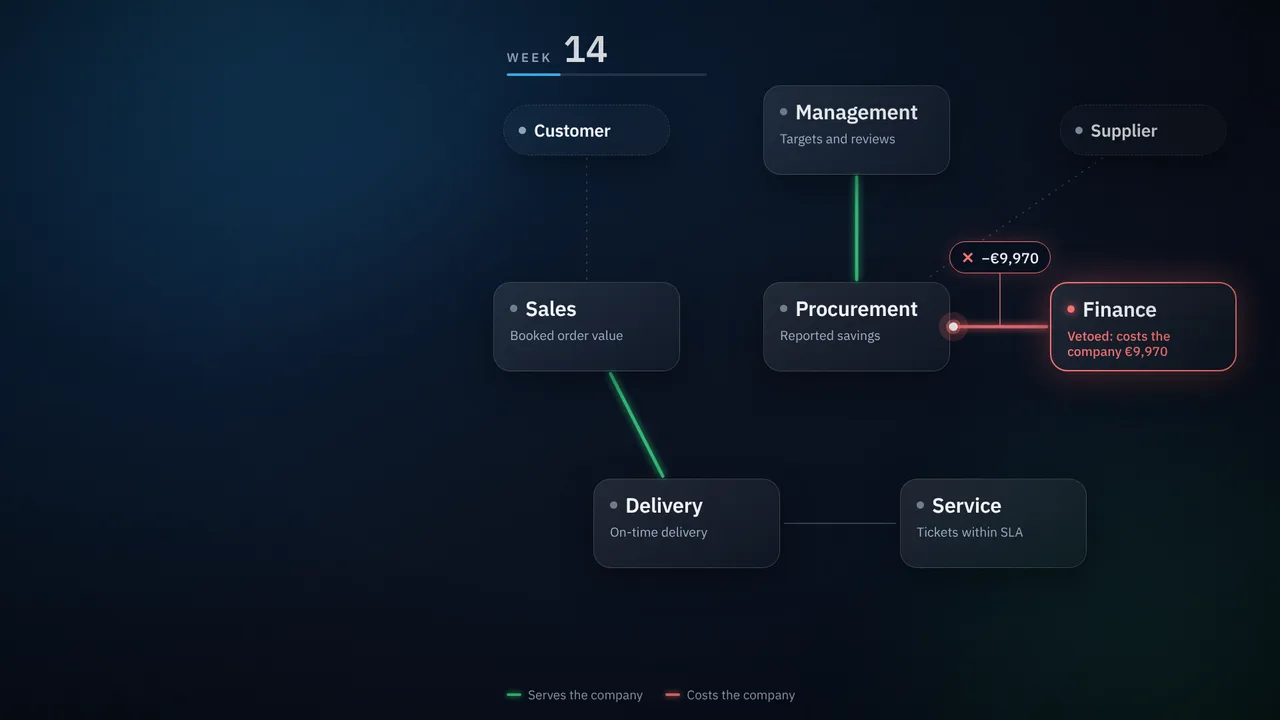
The KPI paradox is what happens when every department meets its own targets and the company as a whole still does worse. Each scorecard is reasonable on its own. Together they reward behaviour that moves cost, risk or delay into someone else's number. This simulator lets you watch it happen in a fictional company, with every figure traced to one transparent calculation.
How conflicting KPIs pull departments apart
Does one of these sound familiar? The simulation shows where such a conflict could come from and why, so you can compare it with what you see in your own organisation. These are common patterns, not findings about any real organisation.
Savings versus payment terms
Procurement is measured on reported savings and Finance on days payable outstanding. A supplier discount that comes with shorter payment terms can lift one number and lower the other.
Bookings versus delivery capacity
Sales is rewarded for orders booked, Delivery for projects finished on time. Bids that ignore the engineering backlog turn into late projects and overtime.
Service levels versus effort
A service team measured on tickets closed within the agreed time can favour easy tickets over the ones that matter most to customers.
Reported versus real numbers
When a target depends on a baseline or a forecast, there is a reason to move the baseline or the forecast instead of the result. An audited baseline removes that option.
Why this keeps happening
Steven Kerr described the pattern in 1975 as rewarding A while hoping for B. Goodhart's law and Campbell's law say the same from other angles: once a measure becomes a target, people optimise the measure. None of this needs bad intent. It follows from how the targets are set.
How the simulation works
Every figure comes from one transparent calculation over a model of a fictional engineering company: payment terms, shared engineering capacity, reward curves, approval rights and measurement baselines. Departments act through stated behaviour profiles or, optionally, AI role agents that choose within fixed rules. Runs are paired: both versions share the same random events, so any difference comes from the one rule you changed. The figures are illustrative because the company is fictional. The mechanism is what carries over to your organisation: who is rewarded for what, who can decide, and which information has to travel between them.
Research, assumptions and methodology
The mechanisms follow published work on incentives and gaming of performance measures. Main sources:
- Kerr, S. (1975). On the folly of rewarding A, while hoping for B. Academy of Management Journal, 18(4).
- Holmström, B., Milgrom, P. (1991). Multitask principal-agent analyses: incentive contracts, asset ownership, and job design. Journal of Law, Economics, & Organization, 7.
- Courty, P., Marschke, G. (2004). An empirical investigation of gaming responses to explicit performance incentives. Journal of Labor Economics, 22(1), 23-56.
- Oyer, P. (1998). Fiscal year ends and nonlinear incentive contracts: the effect on business seasonality. Quarterly Journal of Economics, 113(1), 149-185.
- Schweitzer, M. E., Ordóñez, L., Douma, B. (2004). Goal setting as a motivator of unethical behavior. Academy of Management Journal, 47(3), 422-432.
Assumptions: the figures are illustrative and before tax; the funding cost of shorter payment terms is the cost of capital times the reduction in average payables; effects on quality and supplier resilience are not modelled.
A free experiment by Voice2Evolve
Check it against your own reality
- Pick the situation that feels closest to yours and watch how the scorecards and the company result drift apart.
- Change one thing, such as the savings KPI, who has to approve, or what information reaches whom, and rerun the same year.
- Notice what moves and what does not, then ask whether the same cause could be at work in your organisation.
Questions and answers
- Is the KPI Paradox simulator free?
- Yes. It needs no account and no email address. Only the optional Your organisation mode asks for an email address, to send you a report.
- Is it a forecast for my company?
- No. It shows how incentive structures interact, using mechanisms documented in incentive research. The exact figures belong to a fictional company; the questions it raises are the ones worth asking your own team. It is not financial, HR or legal advice.
- What is Goodhart's law?
- It is the observation that once a measure becomes a target, it stops being a reliable measure, because people start optimising the measure itself.
- What can I change in the simulation?
- You can change one rule at a time, for example an audited baseline, more capacity or a different reward curve, and rerun the same year to see what changes.